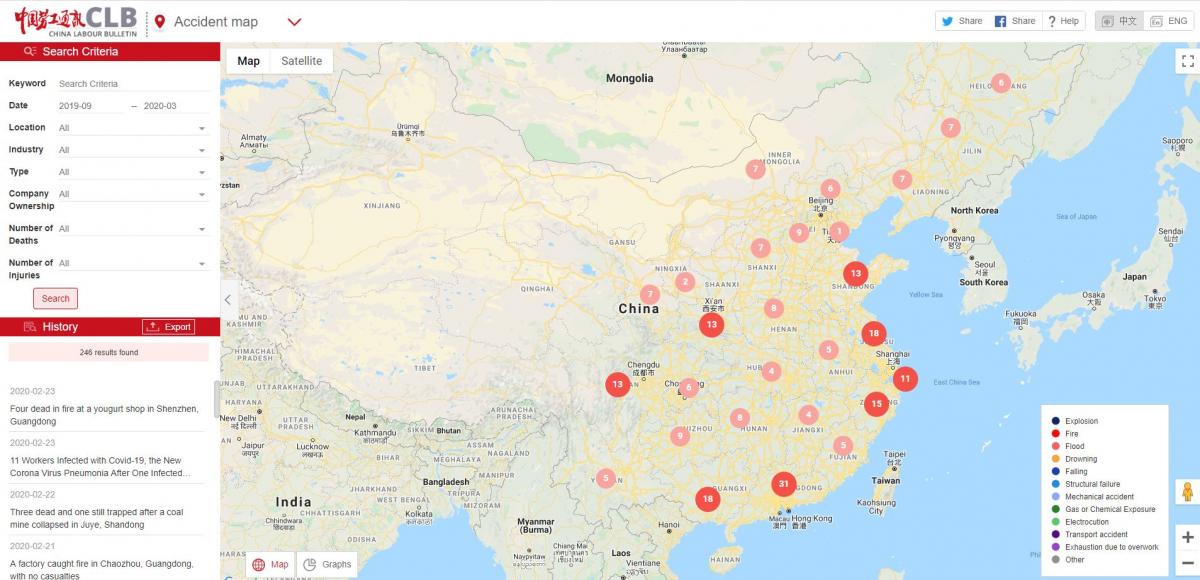
China Labour Bulletin established the Work Accident Map in December 2014 to track and categorise workplace accidents reported in domestic media.
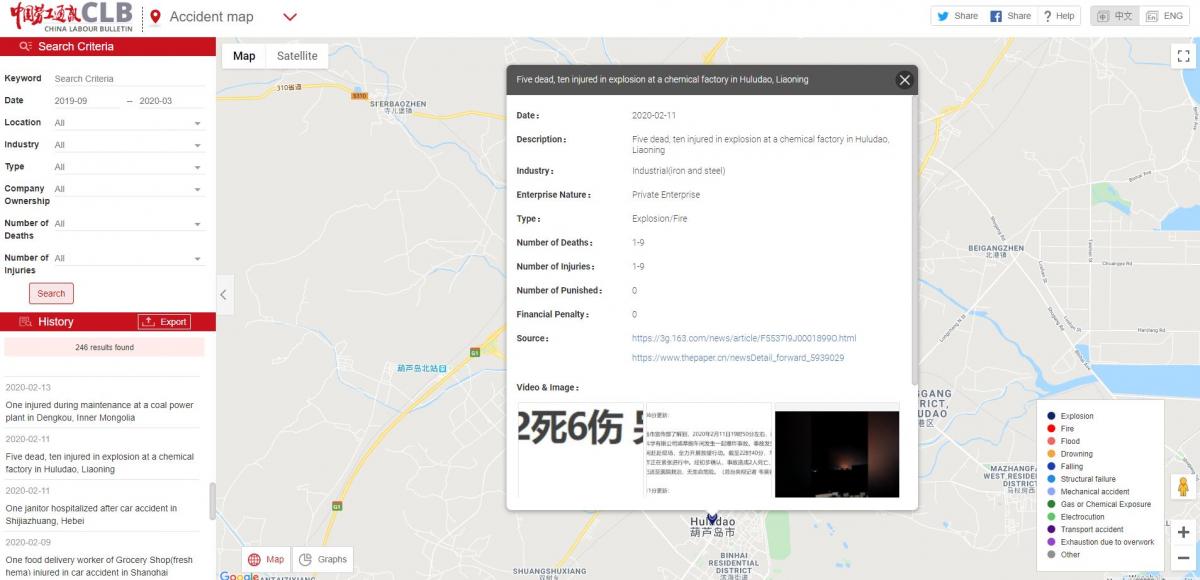
The Accident Map has more than 5,000 individual entries that list the date and location of the accident, the number of deaths and injuries, the type of accident (explosion, structural/mechanical failure, etc.) and the industrial sector it occurred in. It also includes the original media reports that provide valuable detail on how the accident occurred and the response of the authorities. The vast majority of these reports are in Chinese, but some major accidents include English-language reports.
The purpose of the project is not to record every single work accident in China (there are simply too many), but to provide a qualitative and descriptive dimension to the anonymous statistics and generalised reports issued by the Chinese government. According to the China Social Statistical Yearbook, there were over 30,000 production safety accidents nationwide in 2021, resulting in a death toll exceeding 26,000. However, the Accident Map recorded only 540 incidents that year.
Readers should note that the industry distribution on the Accident Map differs significantly from official data (see the pie chart below). One reason is that the information sources for China Labour Bulletin are mainly government reports and media, leading to sampling bias. For example, there is a website that regularly and frequently reports coal mine accidents, hence more coal mine accidents are included.
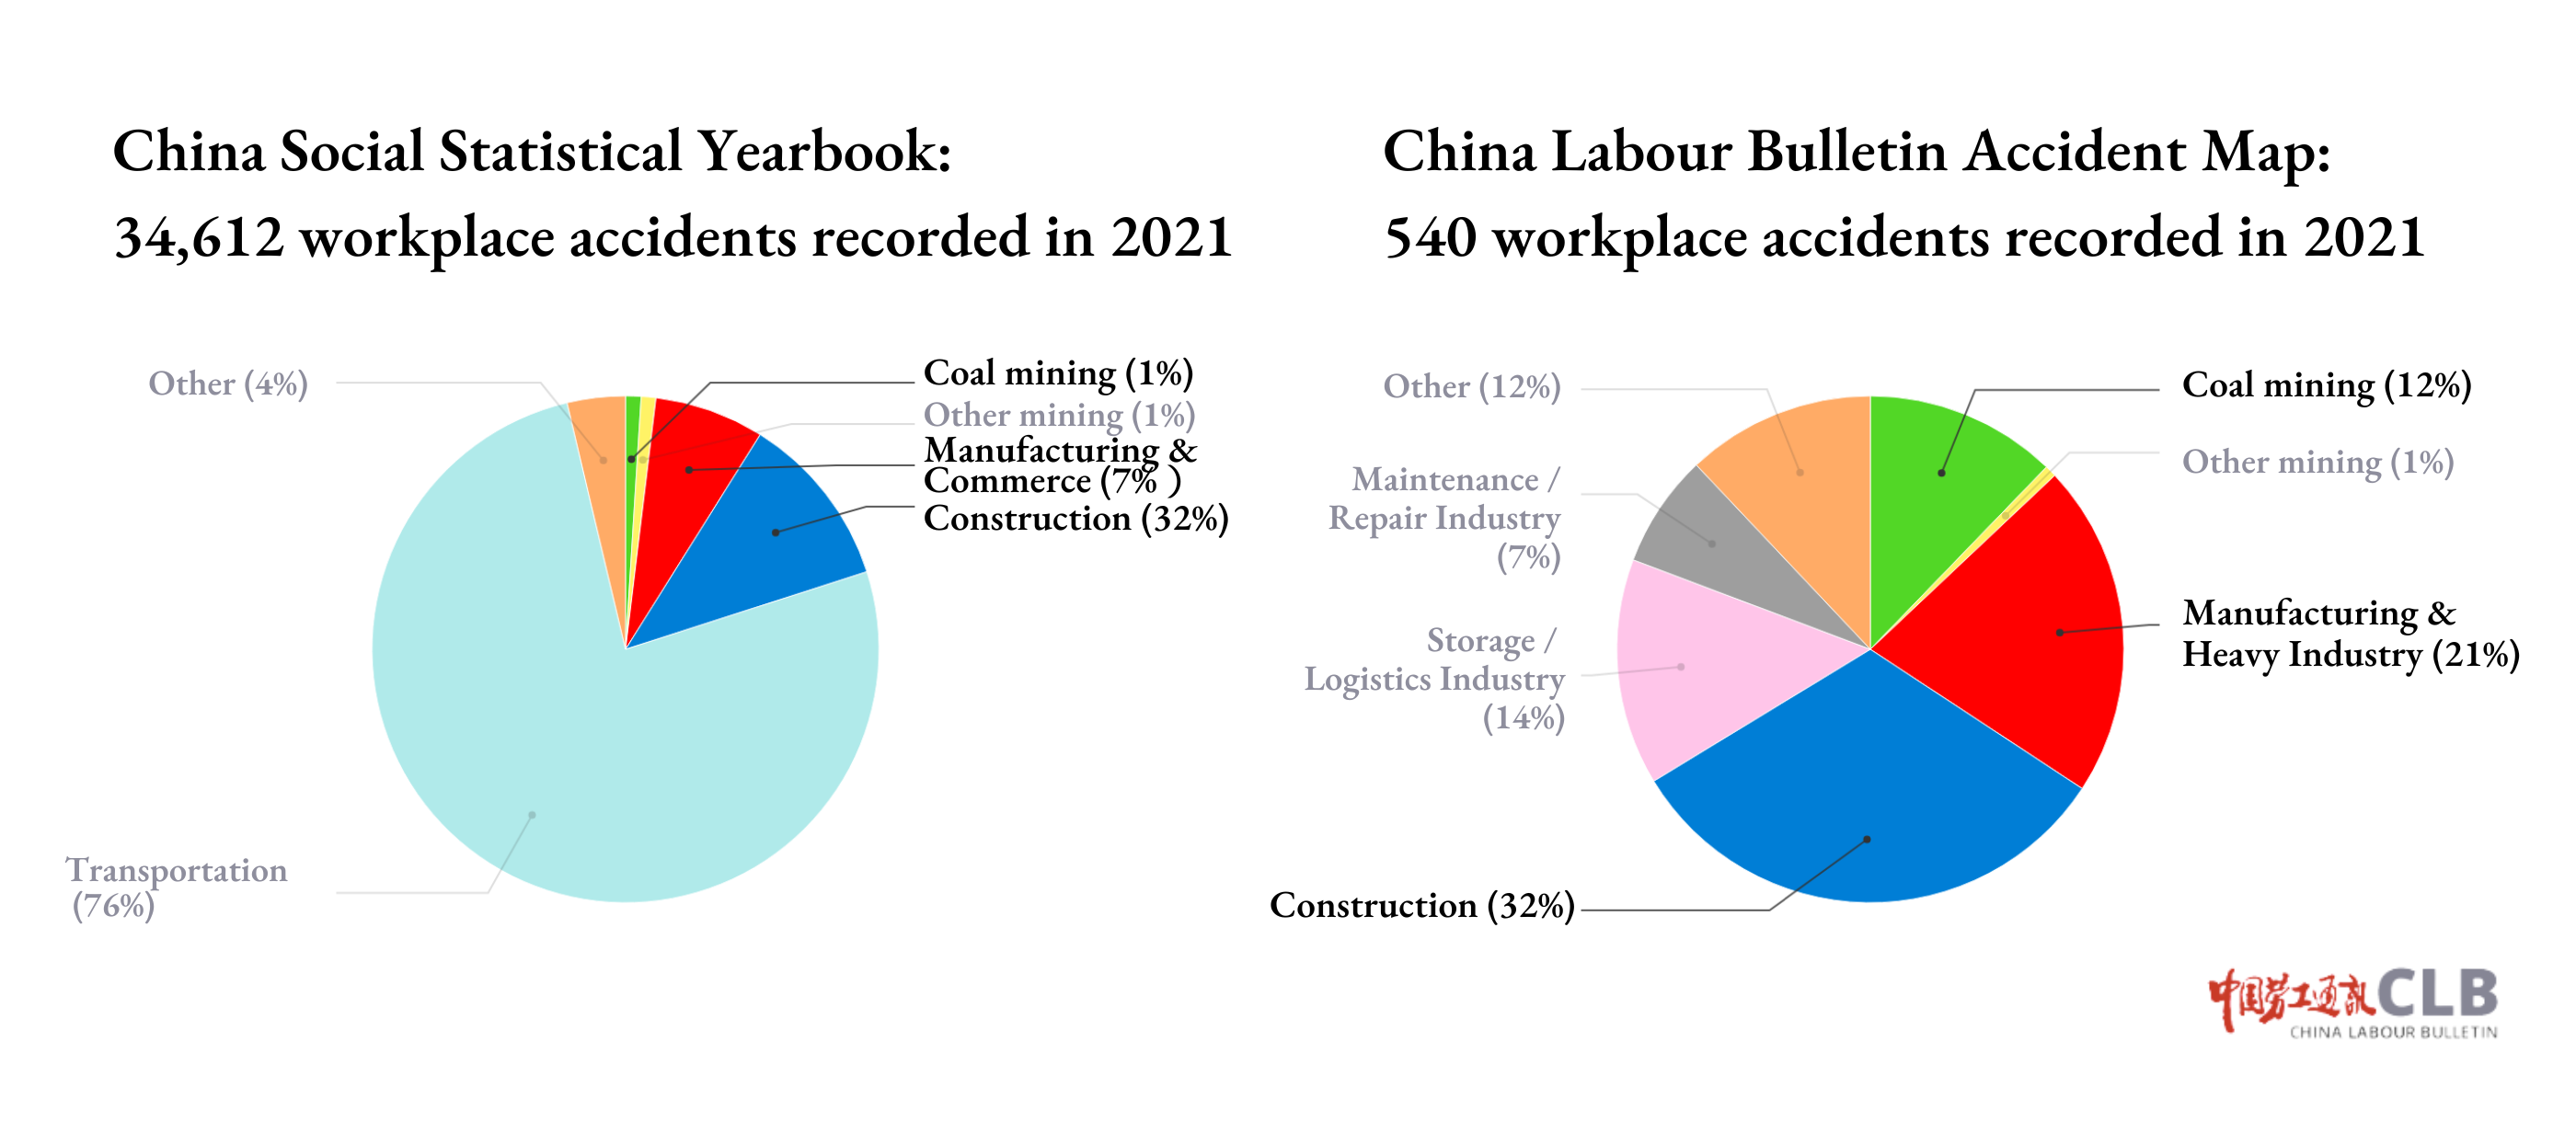
On the other hand, it is more challenging to determine based solely on official reports whether accidents in the transportation industry are work-related incidents and whether workers are injured. The map mainly includes traffic accidents involving trucks, categorized under "Warehousing and Logistics."
Because China Labour Bulletin has focused its work on the coal mining, construction, and manufacturing industries, more cases from these industries also tend to be included in the map.
Another sampling bias is that the Accident Map tends to collect large-scale accidents due to clearer reporting and more media coverage. In 2021, the map collected 13 major accidents (with 10 or more deaths), accounting for 2.4% of all collected accidents. In contrast, the China Social Statistical Yearbook shows 17 major accidents, constituting only 0.05% of all accidents.
The Accident Map includes accident types that official data does not encompass or separately classify, such as sudden death or death from overwork, heatstroke, and accidents involving food delivery workers. The China Labour Statistical Yearbook shows the number of sudden deaths at work or during working hours, or within 48 hours of unsuccessful rescue efforts (approximately 11,700 cases in 2020). However, it does not include cases of sudden death outside working hours that are likely related to overwork.
Starting from December 2023, due to shifts in focus and manpower, the Accident Map has prioritised the collection of manufacturing industry incidents, and accidents in coal mining, construction, and transportation that involve three or more deaths or ten or more injuries are prioritised. Additionally, with the use of a new search system and increased reliance on accident reports from local emergency management bureaus, there may be delays in incident input. For instance, case input for January will be completed by late February or early March.
The baseline for inclusion on the map is at least one worker death or injury, or an incident affecting three or more workers but not necessarily leading to injury or death, such as being trapped in a coal mine or being forced to evacuate from a fire. We will also include some incidents that official records exclude, such as the fires at migrant worker housing complexes in Beijing in the winter of 2017 and the deaths of five young kindergarten teachers in November 2018, which highlighted the hazardous living conditions that low-paid workers are forced to endure.
To undertake an analysis of the data recorded on the map, users may select the time frame of interest and the categories to compare. For example, a user could search for the relative numbers of accidents in the manufacturing and storage/logistics sectors from January 2016 to December 2017, or the number of accidents involving motor vehicles in 2018. All this data can be exported to an .xls file by clicking on “Export Data.”
The map was updated in May 2022 to include additional industrial sectors due to safety risks of China’s workers. To the original list of coal mining, other mining, construction, heavy industry, manufacturing, maintenance, sanitation, warehousing and logistics, five additional industrial sectors were added: medical, firefighting, fishing, energy and internet technology.
Users can also search according to company ownership to see in which ownership types state-owned enterprises, private enterprises etc.) accidents are most concentrated. Currently, this category only dates back to January 2020, but we plan to gradually backdate the data.
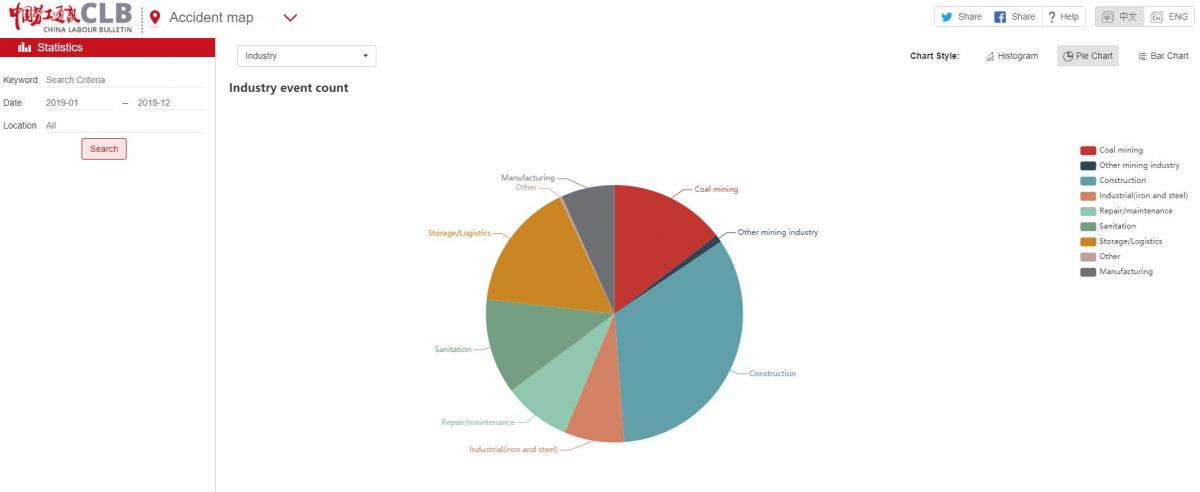
Like the Strike Map, the Accident Map is able to generate graphic charts which are accessible by clicking the “Graphs” button in the bottom left-hand corner on the map. This will produce a histogram displaying the number of accidents in each year or each month for the date range selected.
Selecting the pie chart function allows users to compare data based on different criteria such as industries, types of accidents, number of deaths and injuries. Hovering the cursor over the chart will display the actual number and percentage of incidents in each category.
The bar chart combines the histogram and pie chart functions so that the data for each year or month over a defined time period can be broken down into specific industries.
For an overview of work safety in China and a more detailed analysis of the map data, please see our explainer on work safety, which examines the legal and administrative framework in China, the most common types of work-related accidents, occupational disease, overwork and dangerous housing conditions, as well as offering a series of recommendations on how work safety can be improved.